This overview includes naming conventions, help and training options, navigation, lists, project header, ribbon, related records, and charts.
These tips and hints apply to all Sensei IQ areas.
Main Application Elements
- Within the top navigation bar on the left, you have the app launcher
 and the path identifying where you are in the application.
- Down the left side of the screen is the site map, with the area picker
 located at the bottom.
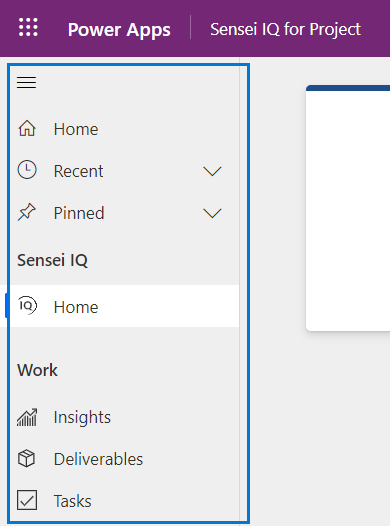
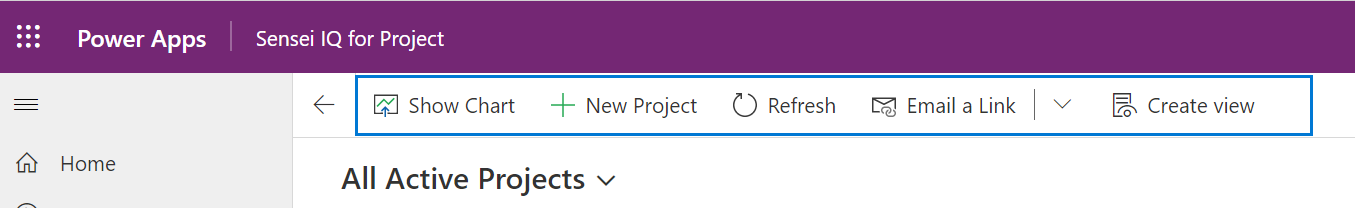
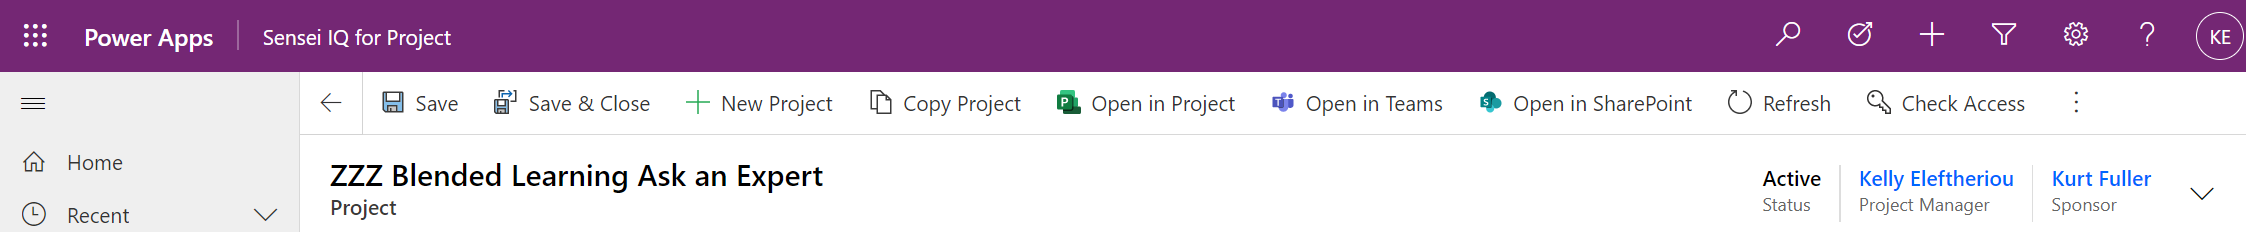
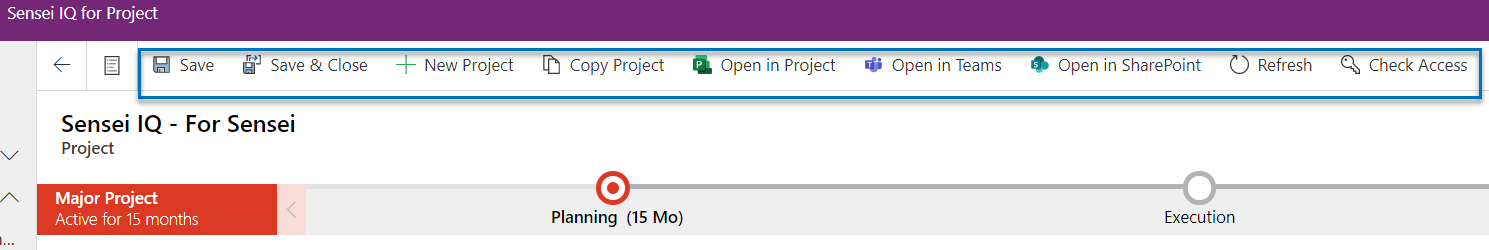
- The options listed just below the top navigation-bar are called buttons and are located on the ribbon.
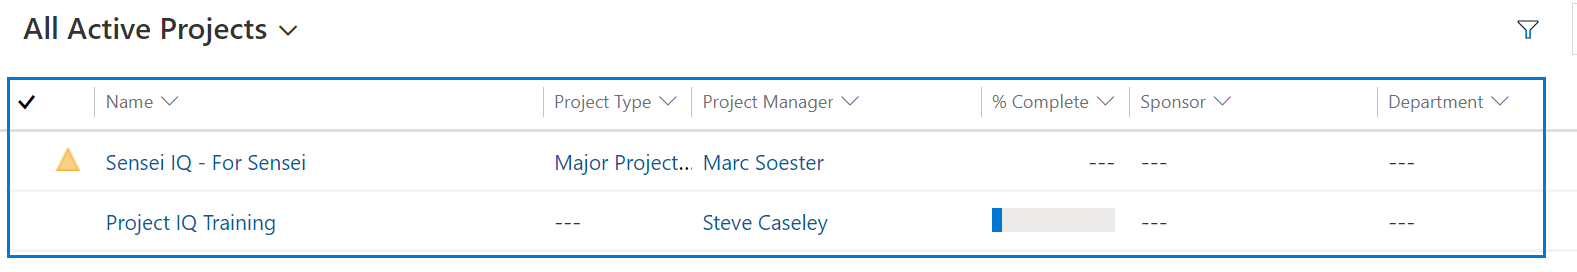
- Just below the ribbon is the header. On the left you have the name of the current view being displayed with the option to select other available views, and on the right, view-search-and-filter boxes specific to the current view.

- In the list view, each item listed is called a record.
- When accessing a record, such as a project, you will see the same basic elements on each screen: the site map, area picker, top navigation bar, ribbon, and header which will vary based on the data being viewed.
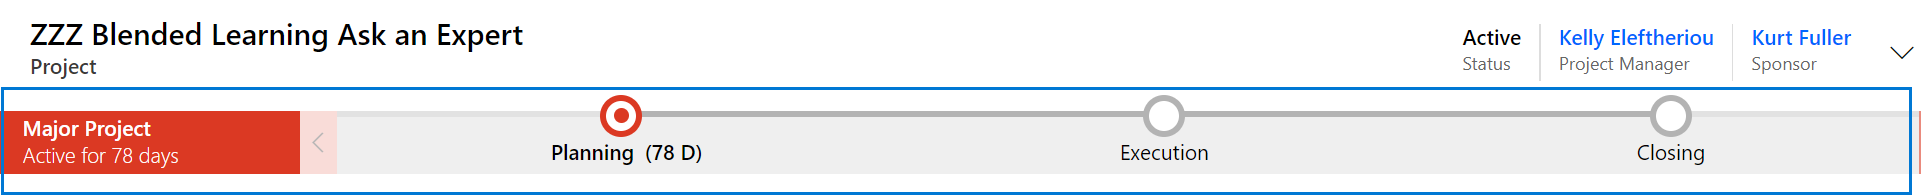
- Just below the header is the Business Process Flow, which shows the current stage of the project. The business-process-flow applies to certain project types and records.
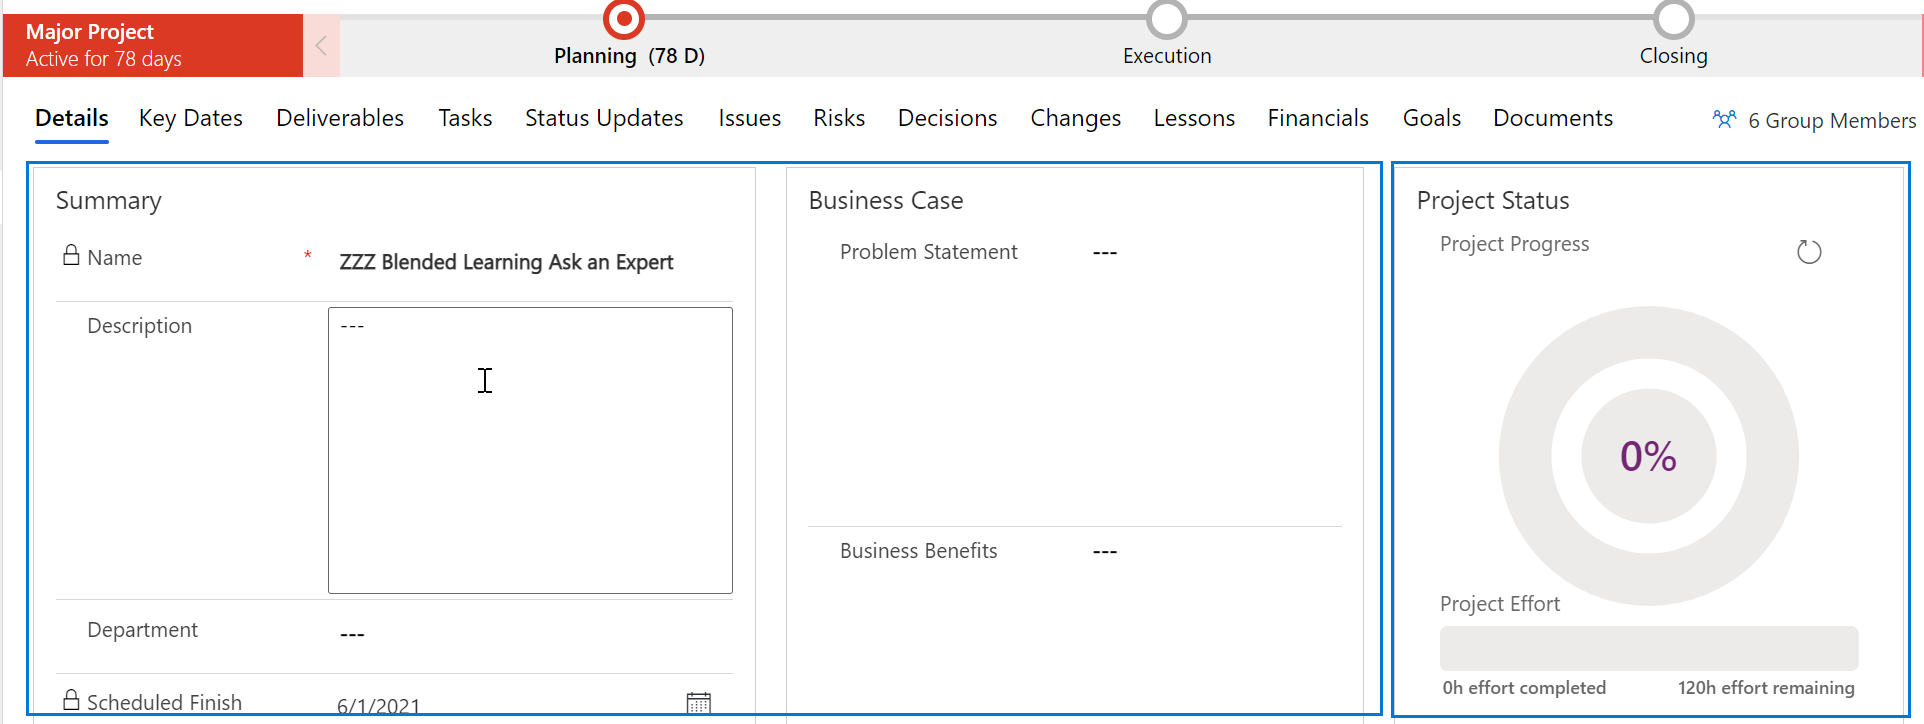
- Each section of the details screen is called a pane. Where there are fields to be populated, as in the first two panes, those are called forms. The third pane contains a visualization populated by the underlying project data.
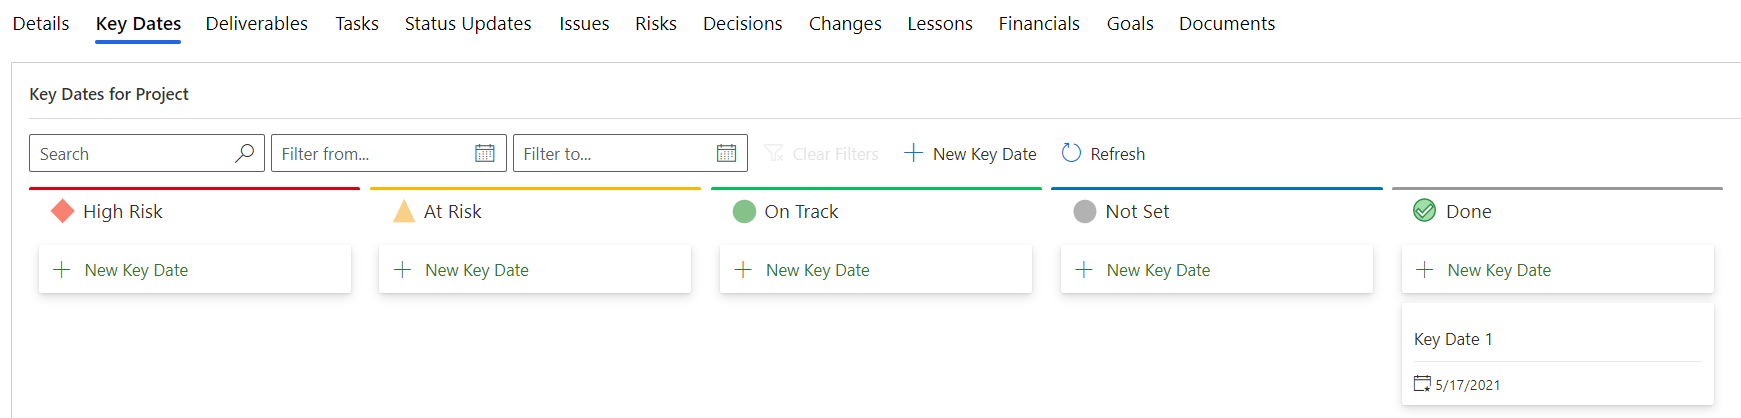
- On the Key Dates screen, each key date is displayed on a card in a Kanban style pane.
- Within the Issues tab you have a visualization-or-chart on the left and the list of items on the right. Within the list on the left, there is the sub-ribbon containing buttons with additional options such as creating a new issue
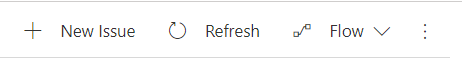 . Each supporting item screen will have a variety of combinations of visualizations, lists, cards, etc.
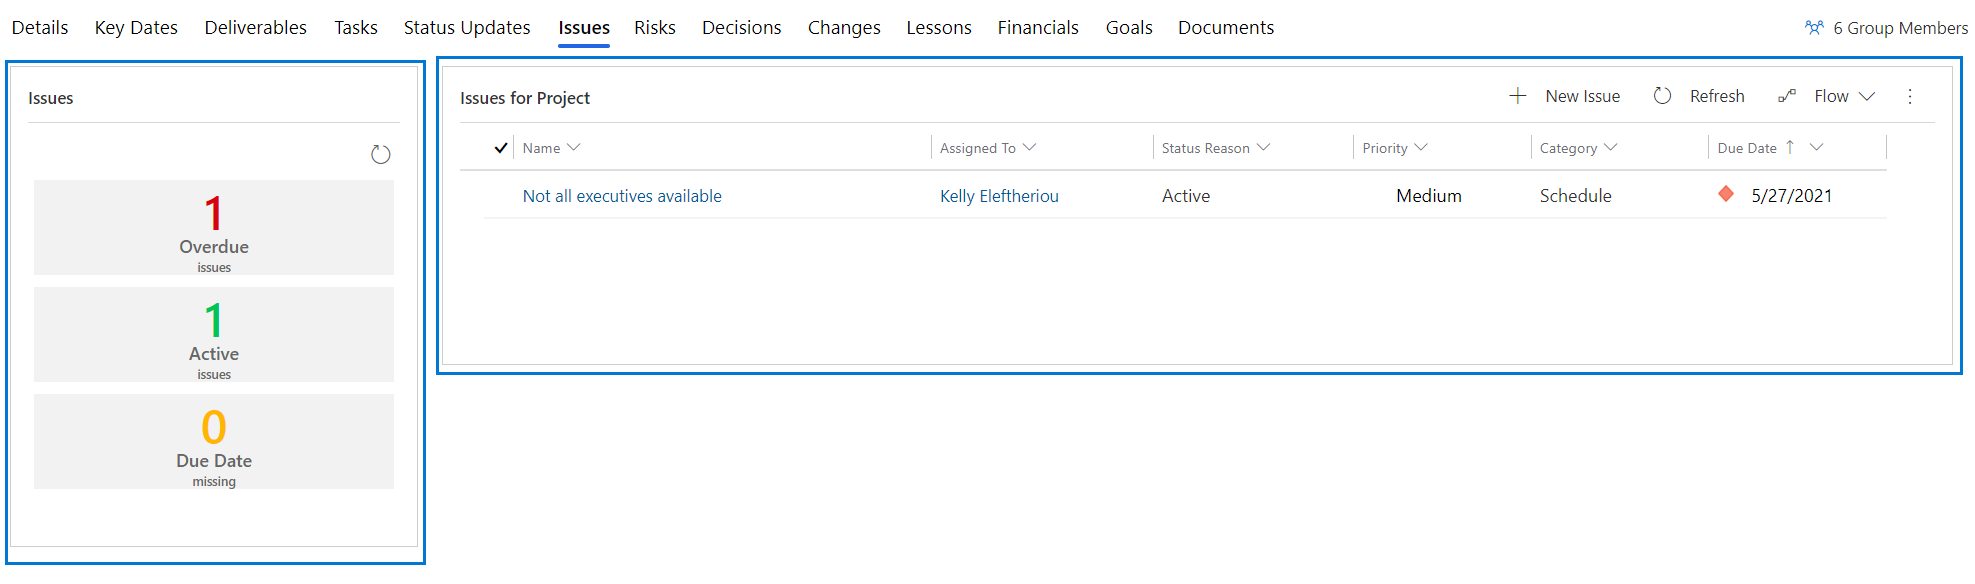
Help and Training Features
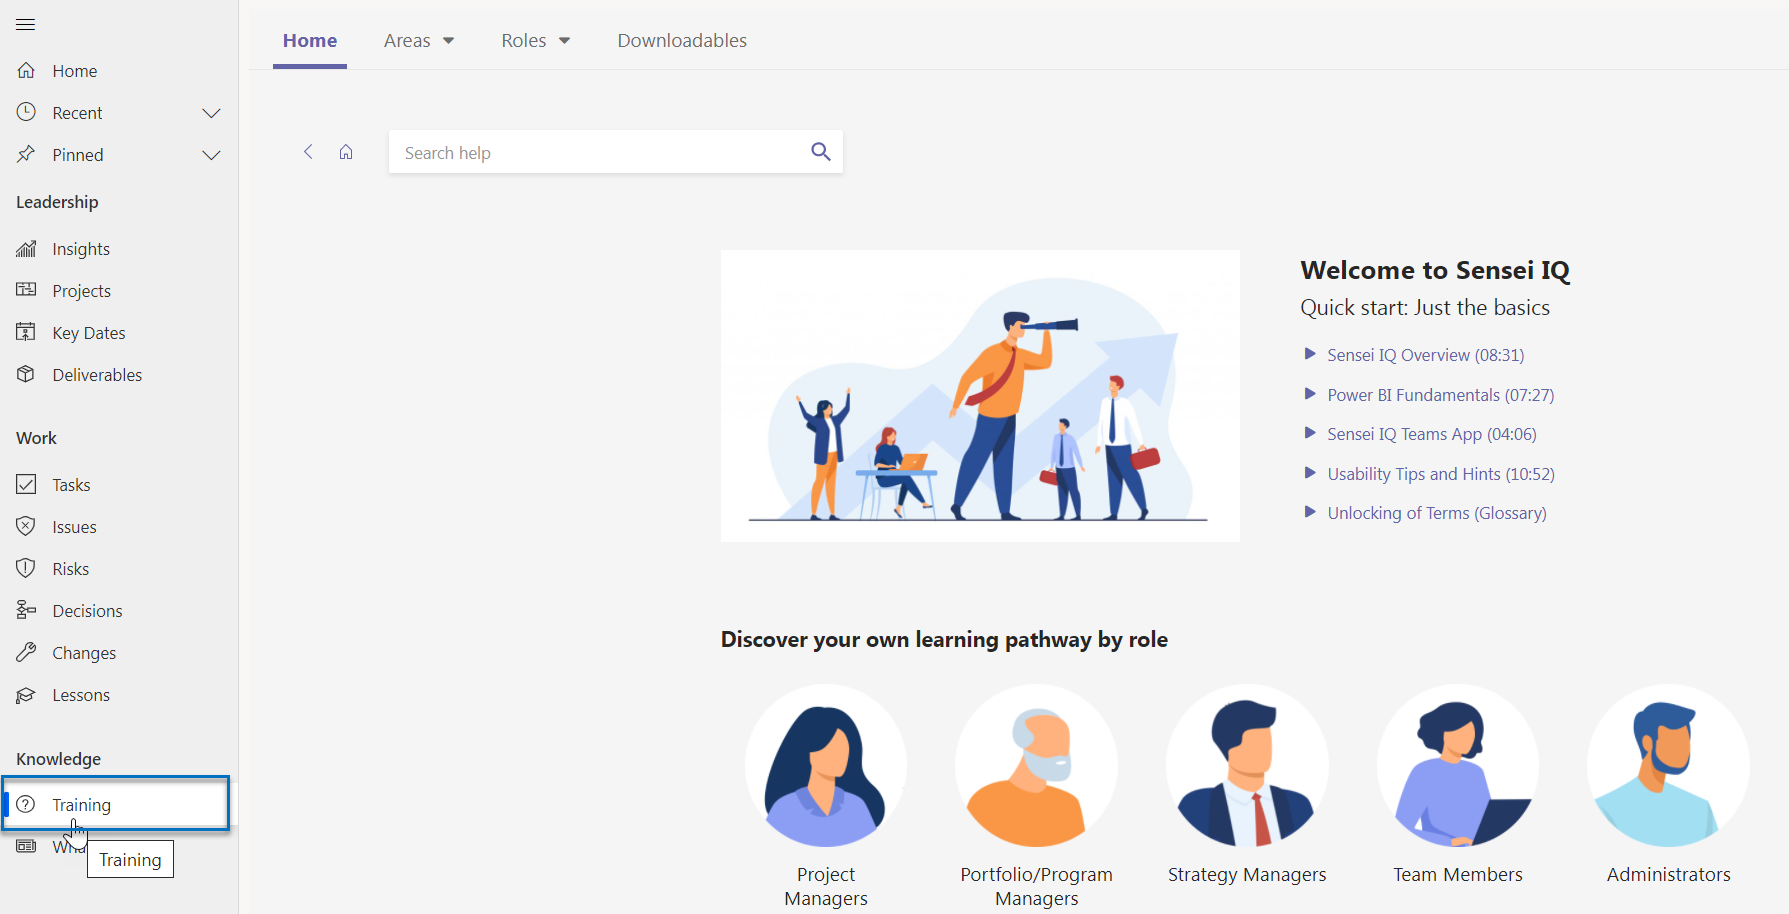
- The Welcome Screen showing the high-level content of Sensei IQ will appear when you launch Sensei IQ. This screen can be turned off using the checkbox at the bottom.
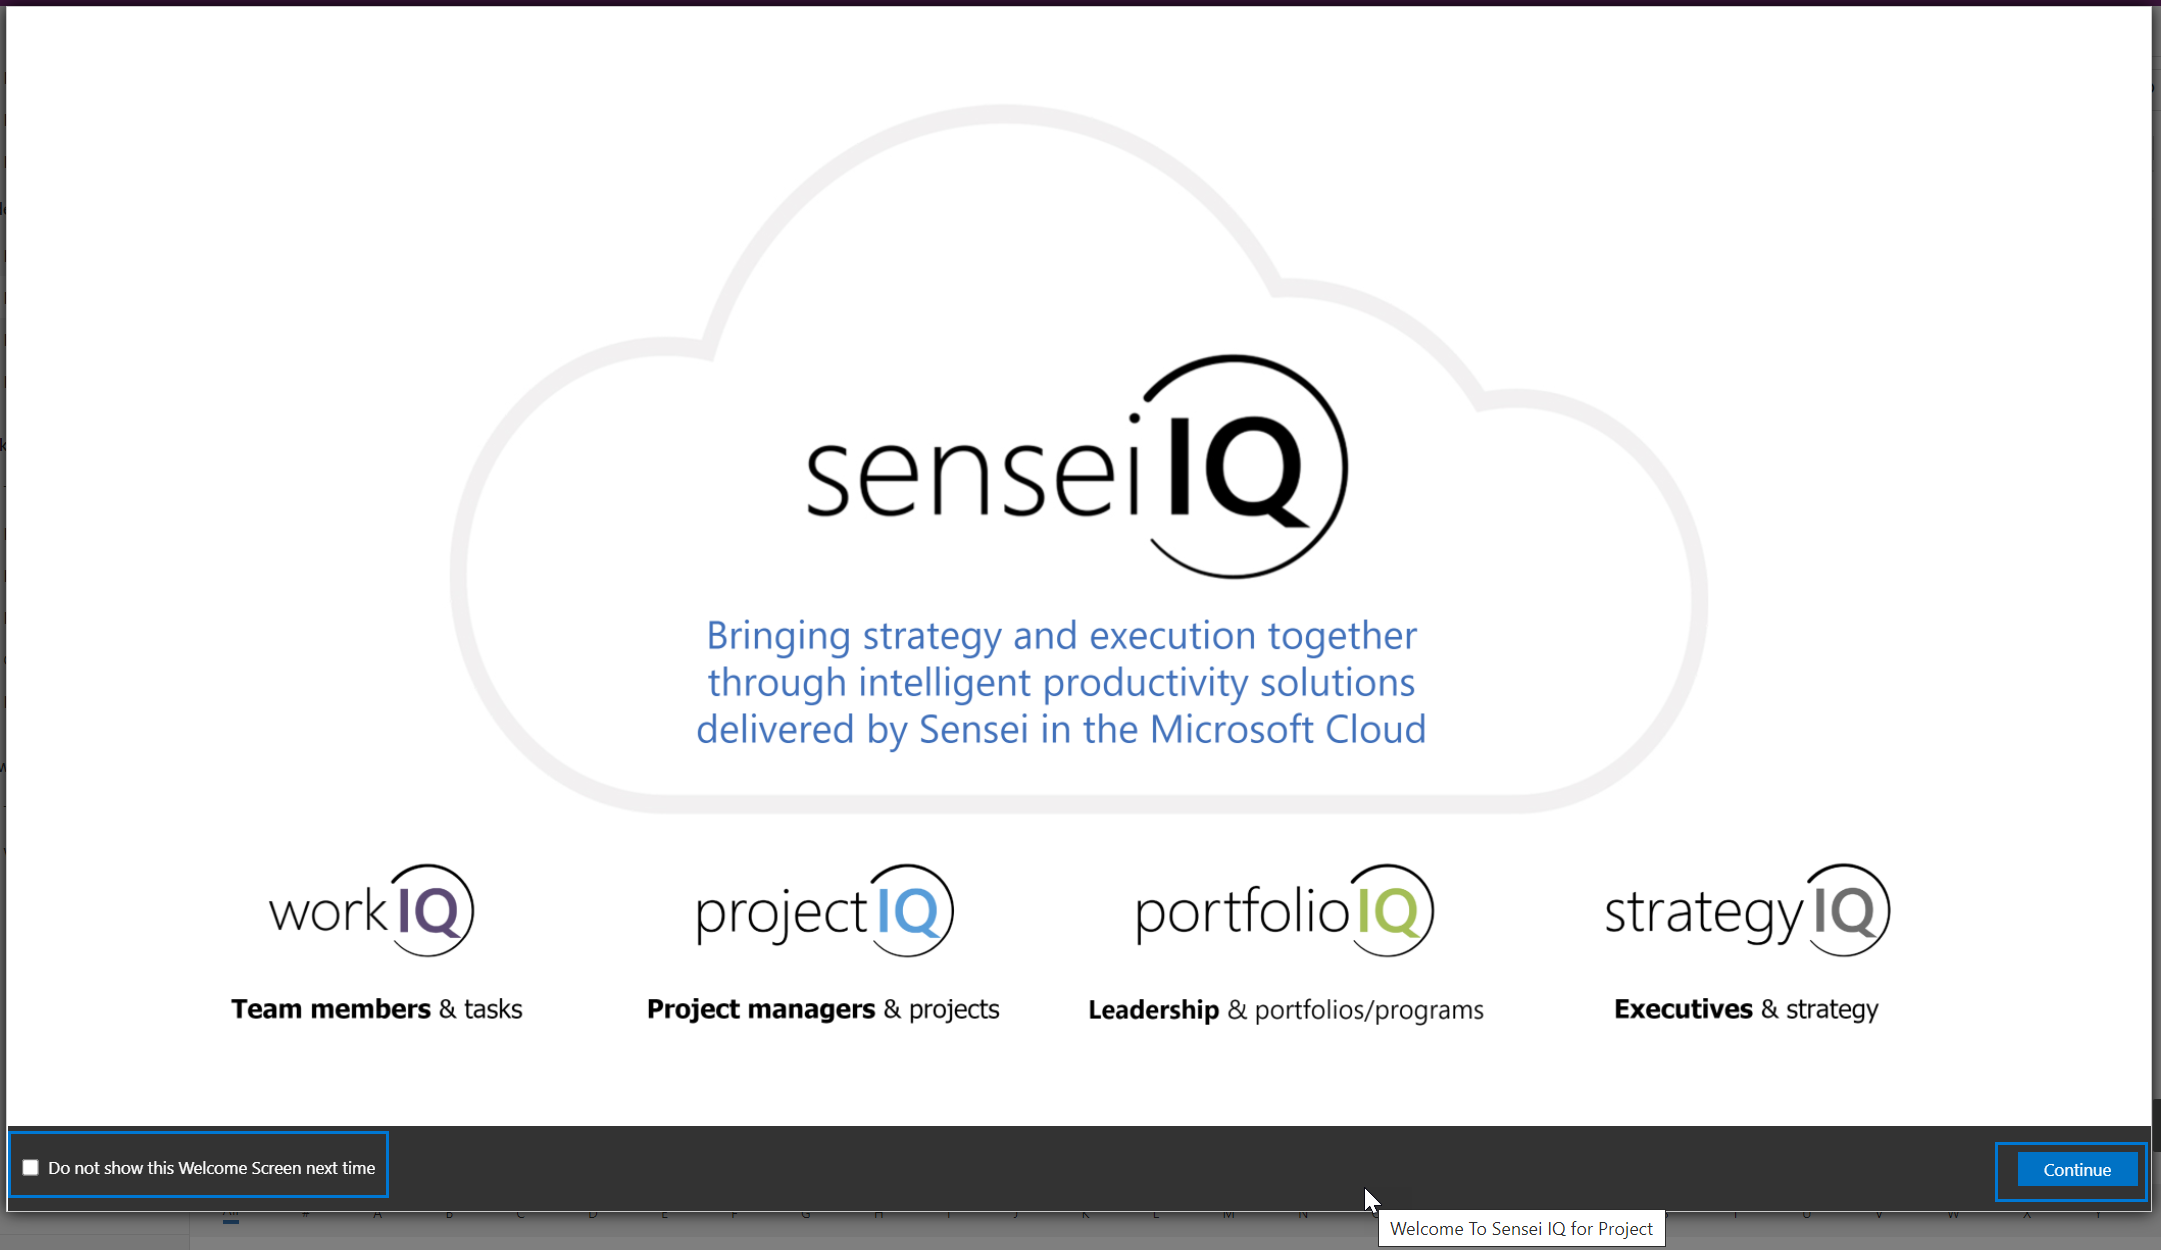
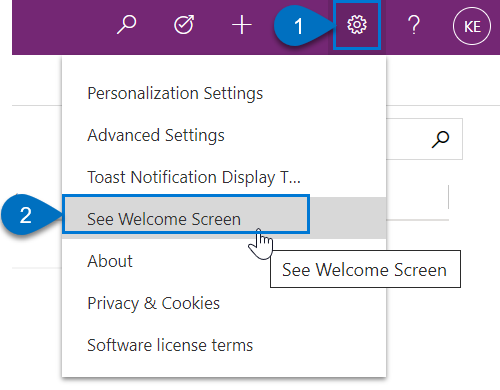
If the Welcome Screen has been turned off and you would like to see it again, you can turn it back on using the settings gear in the top navigation bar.
- This in-app training section can be accessed by clicking Training from the sitemap under Knowledge. It offers a complete series of lessons like this one to help you learn how to use every area of Sensei IQ based on topics, roles, and areas in Sensei IQ at the point of need. Instructional videos and downloadable job aides with step-by-step instructions are also available for self-directed learning.
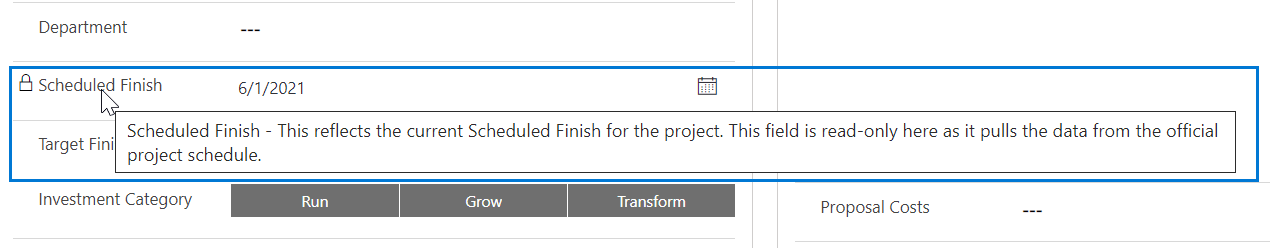
- As you work with the various forms throughout Sensei IQ, there is field level help available by mousing over the field name. Field help provides guidance on field purpose and use.
- On each Insights report page, there is an info icon.
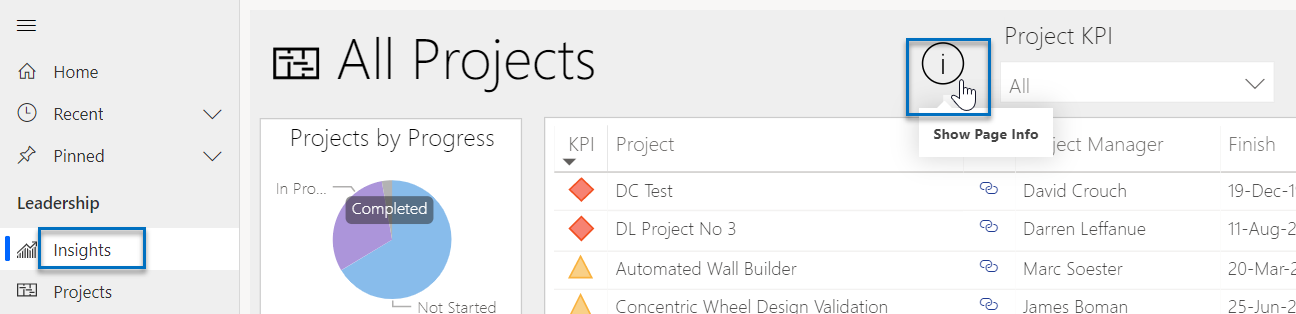
When you click on that icon, an informational pane opens explaining the highlights of that page.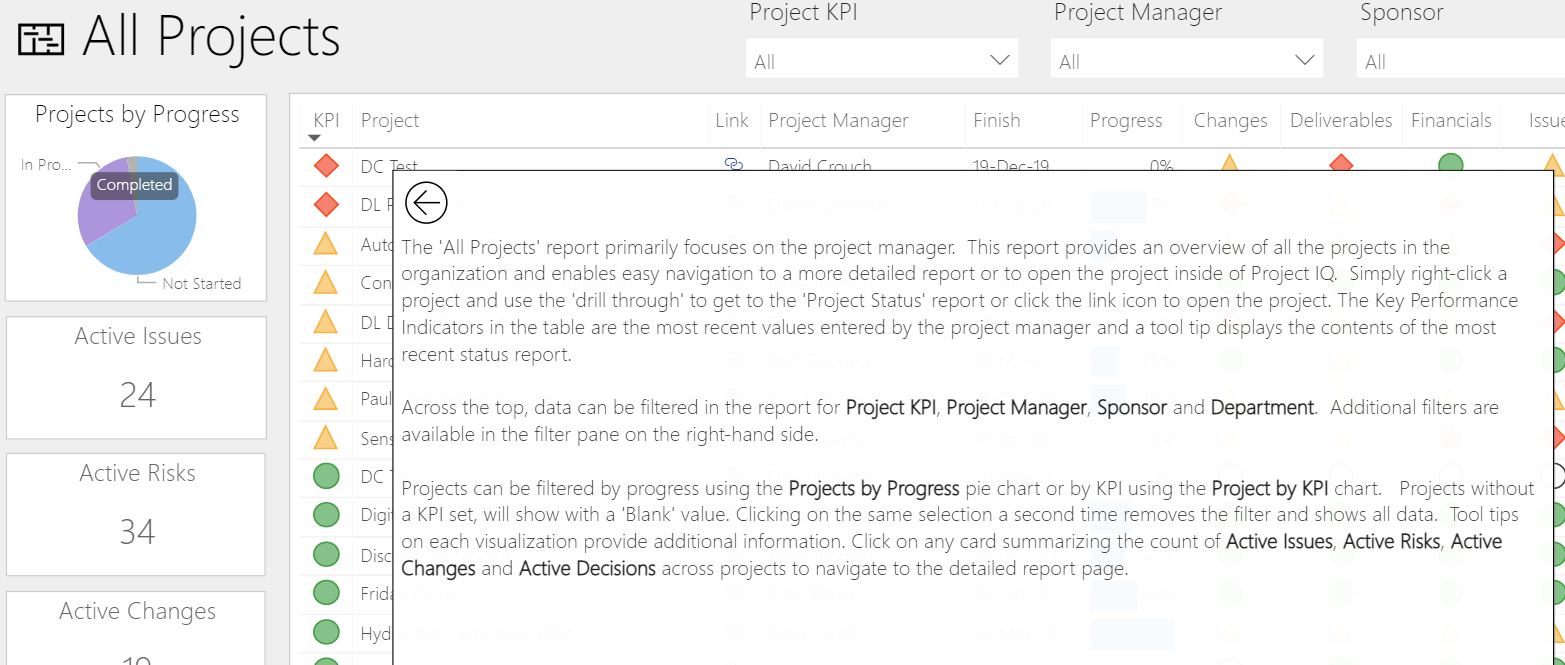
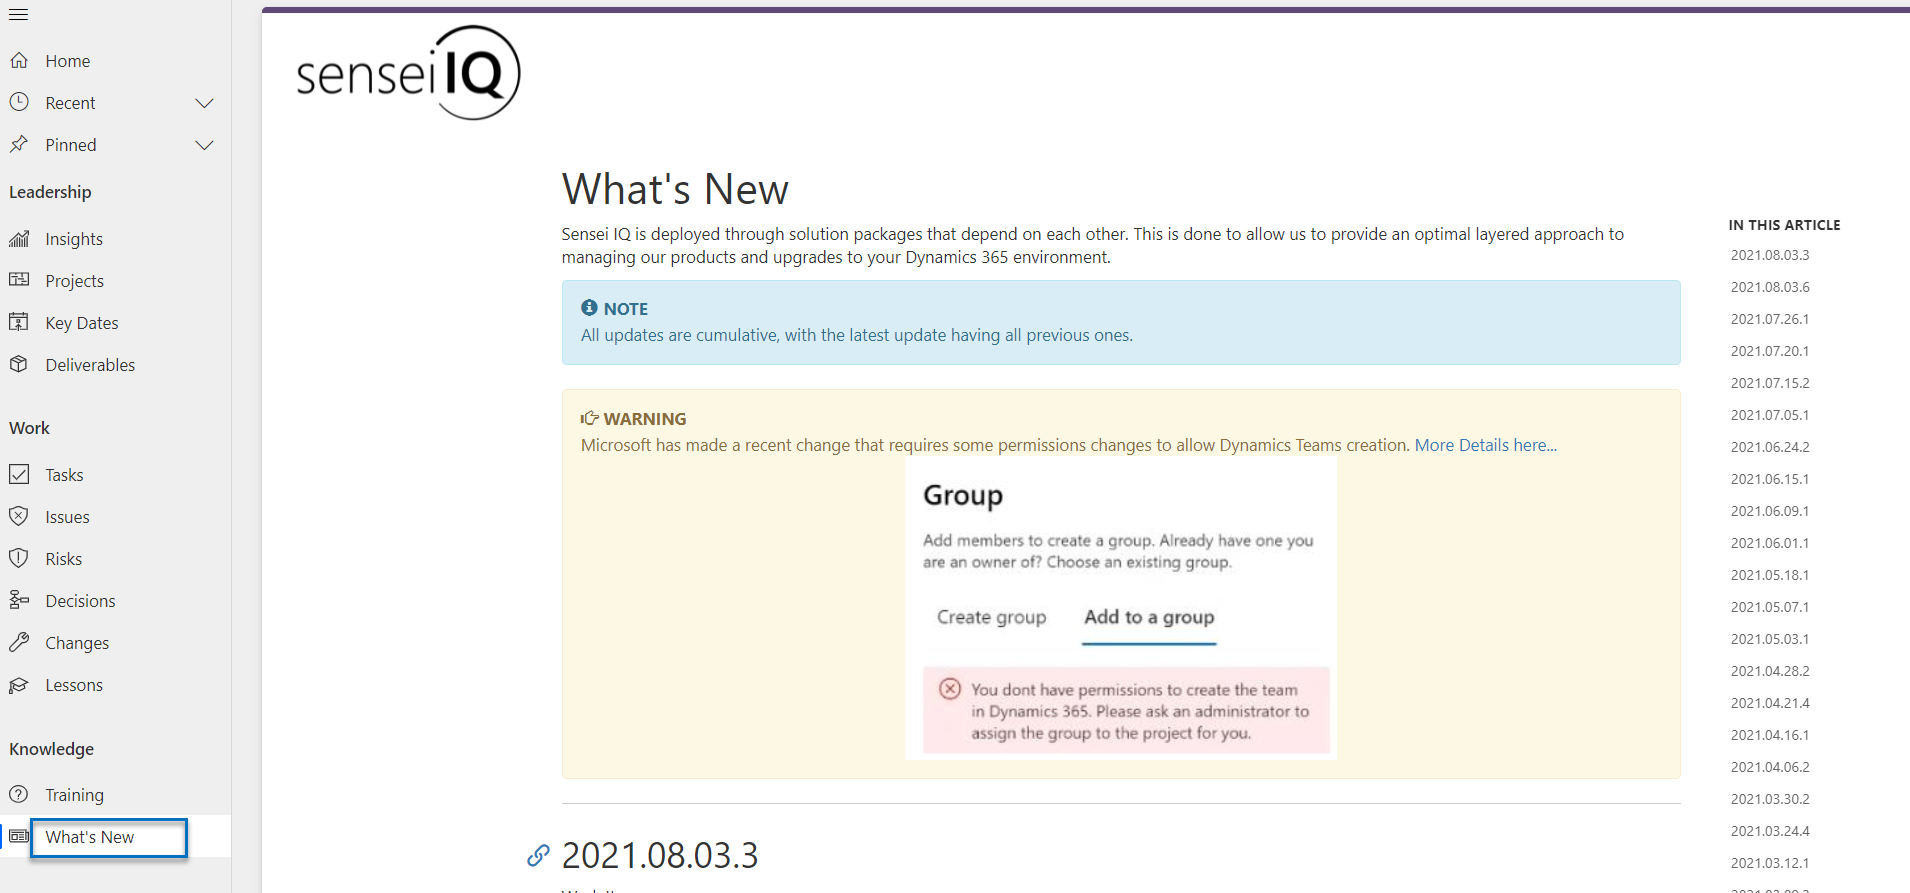
- The What’s New option from the sitemap under Knowledge provides the current version of your organisation’s solution package that you are using as well as the recent solution updates that have been deployed and will be rolled out.
- And finally, the Sensei IQ Teams help pane. The Teams integration is feature rich and this help pane will assist you with navigation and screen controls to ensure you can take full advantage of this integration.
Navigation Basics
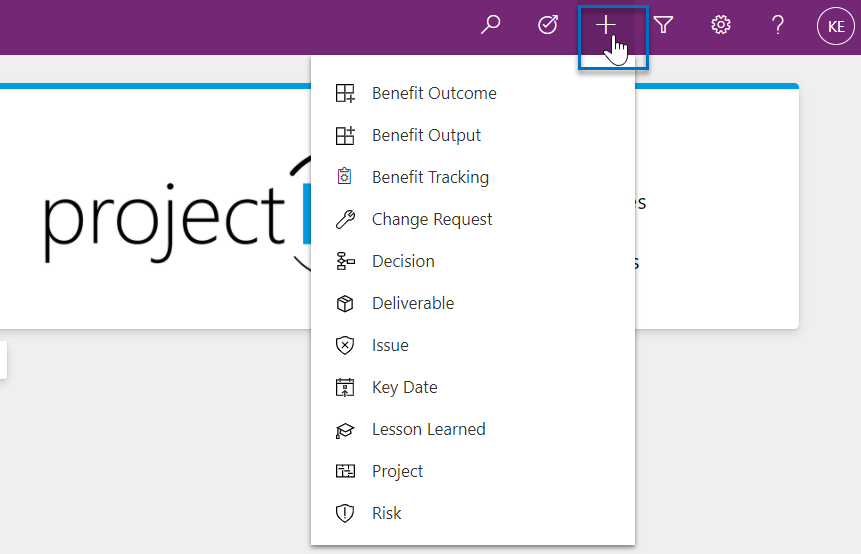
- From the home page you can access the different areas and features and create new records by clicking the plus (+) icon on the right side of the top navigation-bar.
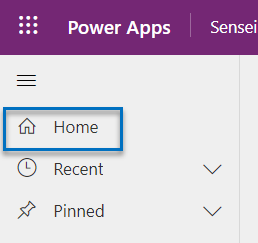
- Clicking on Home in the site map from any area will bring you back to the homepage.
- Another way to navigate to specific IQ areas is by using the area picker in the lower left-hand corner.
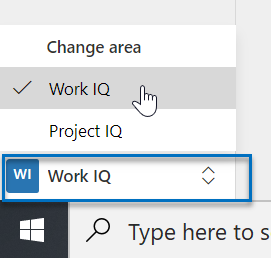
- The options on your home page and in your area picker will be based on what level of licensing your organization-has and the level of security assigned to your role.
- The site map changes based on area and provides quick links to recently accessed records, pinned items, Insights reports, and area specific data.
- You can pin frequently accessed items to the site map for quick access by clicking the pin icon next to the item in the Recent list.

Tip: When they are no longer needed, you can easily unpin them by clicking the unpin icon next to the item in the Pinned list. In addition to specific items, you can also pin and unpin your most frequently used views.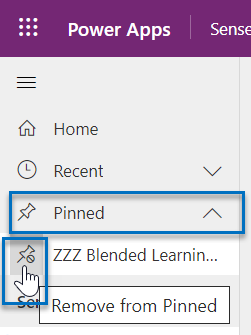
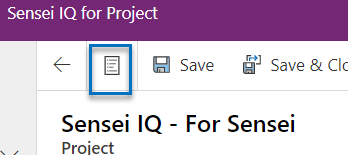
- You can collapse the site map to show only icons or expand it to include the descriptive words by clicking on the icon at the top with three lines.
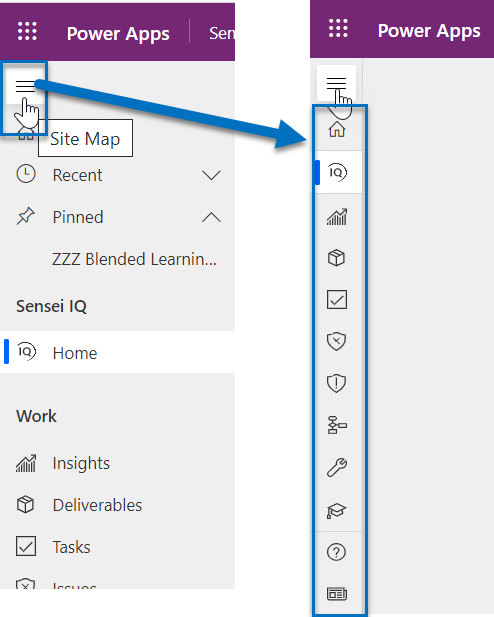
- Site map settings depend solely on your preference and they apply only to the individual user.
- You open a list by selecting the appropriate entity from the home page or directly from the site map.
- Each list has multiple views that can be selected from the drop-down list.
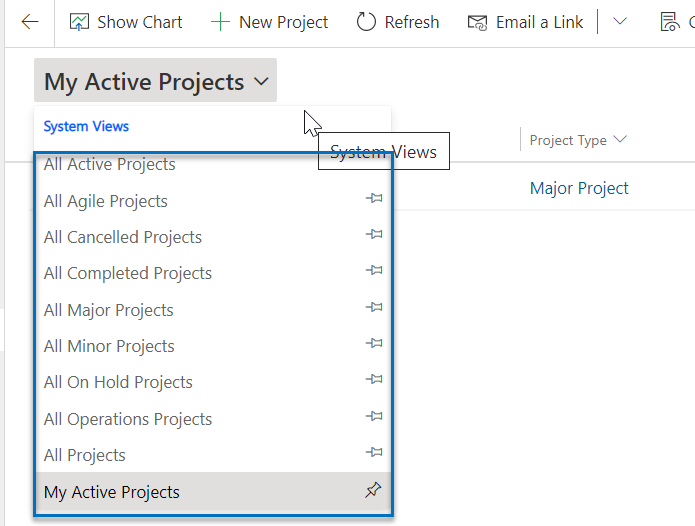
- Data shown will depend on the selected view and your security role.
- Regardless of the view, each list has a default sort which can be changed by clicking on the header of any of the columns.
- Each column will present a list of sort options based on the data displayed.
- You can further filter by clicking on the column header and selecting the Filter-by option.
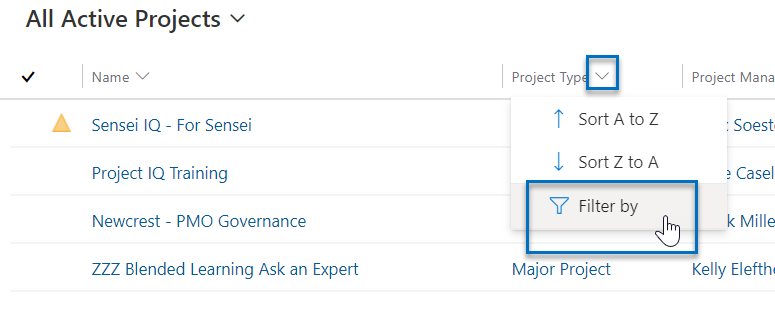
- The filter can be cleared by clicking on the column header again and selecting the clear filter option.
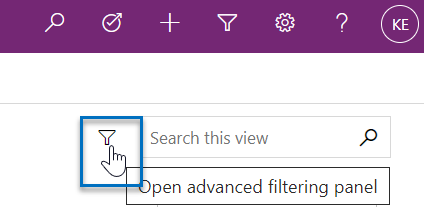
- Advanced filtering across all columns is also available by clicking on the funnel icon in the header.
- Another time-saving feature in the header is universal entity information.
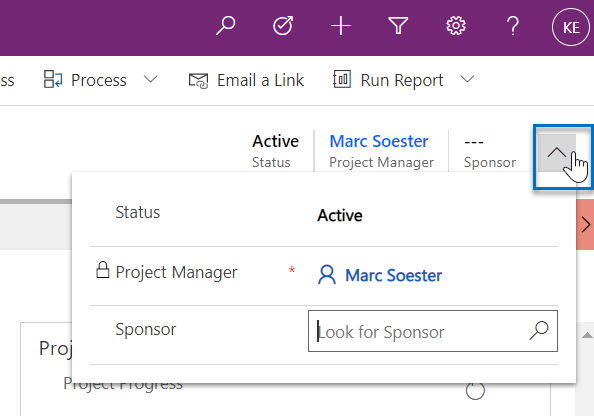
Tip: In this case, status, portfolio, program, project manager, and sponsor. These values can be maintained using the header drop down. This header feature is available throughout Sensei IQ and will vary based on screen content. - Ribbon buttons will vary based on content and your security level.
- When you open supporting project items such as issues, risks, decisions, and so on, the related records icon appears in the ribbon in the second position.
Tip: This related records pane shows all those records for that project based on the selected view. This feature saves a considerable amount of time switching between these records and provides an efficient method for rapid viewing and updating. - Show Chart appears in the ribbon when you have a list displayed.
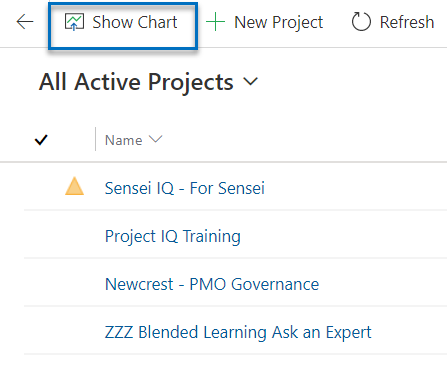
Tip: Charts are filtered by the top-level view and can be further grouped-and-displayed by the second level views available in the drop-down list. Clicking on a specific element in the chart will further cross-filter the data displayed in the list. This provides an at-a-glance summarization of the data you are viewing and real-time analysis when using the filter option. To hide the chart, click the x in the upper right-hand corner of the chart, or hide chart in the ribbon.
Important: It is important to remember to clear the chart filters prior to hiding the chart or the list will only show the results from the last filter. You can clear the chart filter by reselecting the secondary level view from the dropdown list.
Disclaimer: Some images in the instructional video and text instructions contained herein may appear different from (or not available) in your organization’s Sensei IQ instance due to specific custom configurations and/or continuous solution updates. Ensure that you are already an enabled user in the Sensei.IQ for Project application and check out the What’s New page. Contact your system administrator for any assistance.